Pages

Wednesday, 6 November 2013

Case Study: TrackVision

The following blog post is a case study into the product TrackVision which is a Windows application that produces high quality video overlaid with data. TrackVision = Video + Data.

Description

TrackVision supports a wide range of video formats straight from the camera. The objective of TrackVision is that the user should be able to use their video in TrackVision without any conversion or pre-processing. TrackVision accepts HD or standard resolution videos, and in any frame size or aspect ratio, making it a very flexible system. TrackVision accepts data from a variety of data loggers which it can then overlay with the video. It allows you to choose from a selection of dashboard layouts or create a custom layout, enter event information for display on the dashboard and easily save a small section of a lap, a single lap or multiple laps as a separate video. 
TrackVision dashboard
With an in-car video, a data logger and TrackVision, the user can produce professional quality video to analyse the driving as the key to performance improvement and share the experience on the track with friends and family. TrackVision is being used in a multitude of different sports such as the following:
  • Professional racing
  • Amateur racing
  • Club track days
  • Autocross
  • Hillclimb
  • Rally
  • Cars
  • Bikes
  • Karts
  • Power boats
  • Mountain bikers
  • Off-roaders

Specs

Accepted Video Formats:

  • H.264 (including Aiptek 720p at 60fps)
  • AVCHD (including Sony, Panasonic and others)
  • MPEG2
  • MPEG4
  • DivX
  • XVid (including POV-1 format)
  • MJPEG (including GoPro format)
  • Windows Media Video
  • DV (digital video, typically from tape-based camcorders)

Accepted Data Loggers:

  • AiM (all models with Race Studio)
  • Autronic
  • Auterra
  • MaxQData
  • MoTeC (all models with MoTeC i2Pro or i2 standard)
  • Megasquirt
  • Pi Research
  • Racepak (all models with DatalinkII)
  • Racelogic
  • Race Technology (all models with Race Technology Analysis)
  • Stack
  • Traqmate
  • GTech
  • A wide range of hand-hed GPS loggers

Compatible with:

  • Windows application for Windows 7, Vista and XP - 32 and 64 bit
  • Mac user can run TrackVision on Parallels, VMWare or Bootcamp.

Cost

TrackVision V2.2 can be bought for $149. 

Advantages of the System

  • Compatible with a lot of data loggers
  • Video can be in practically any format
  • Application is simple to use
  • Trial version available to download

Disadvantages of the System

  • A bit on the pricey side just for software
  • User still needs to buy camera and data logger on top of the software

References

Tuesday, 29 October 2013

Case Study: ADS-450 SwannSmart

The following blog post is a case study into the device ADS-450 SwannSmart Wi-Fi Network Camera that allows live recording and allows data to be transmitted over network that can be viewed live on a handheld device.

Description
Swann is a well known retail company, known worldwide, that are experts in security monitoring solutions and I.T. peripherals. They have many different products but the one is relevant to this case study is ADS-450 Wi-Fi network camera.
This Wi-Fi camera is not an ordinary IP camera due to its functionality that allows it to connect to ‘cloud’ and saves all the recording. This can be later accessed by any PC or a handheld device from anywhere in the world but requires signing up to cloud service.    
Furthermore, this device is also activated by motion that generates an event trigger. This trigger records that particular event and an alert message is generated, sent to your handheld device. Depending on the contents of the video an appropriate action can be taken.


Specification

General
Video Resolution
VGA 640 x 480
Frame Rate
Up to 30 fps
Night Illumination
8 Infrared LEDs
Audio
1-way audio
Image / Video
JPEG / MJPEG
Cloud Service
Motion Detection & Event Capture available with optional Cloud Service
Cost

£59.89 (inc VAT) – Costco.co.uk

Advantages

  •          SafeGuard features for home and business security
  •          Easily mountable - Flat surface, upside down, on the ceiling or on a wall
  •          Includes an app iSecurity+, compatible with android and iOs
  •          Easy Plug-&-Play setup
  •          Push notifications
  •          Perfect for day/night


Disadvantages

  •          Subscription costs apply for Cloud services
  •          Requires power supply
  •          Wi-Fi connection necessary
  •         No local storage


References


Sunday, 27 October 2013

Objectives

Below is a list of the objectives set out for this project.

Project Objectives
Importance
Literature review into automotive network architectures and protocols.
Major
Develop a network to allow all data acquisition components on the car to communicate and share data.
Major
Develop nodes to interface sensors on the car with the on-board network.
Minor
Literature review into on-board to off-board wireless communication technologies.
Major
Design, implement and test a wireless channel for communication.
Major
Development of nodes to interface on-board network and off-board systems.
Major
Development of on-board data logger.
Optional
Literature review into existing analysis systems.
Major
Development of software and/or integration of 3rd party software package(s).
Major
Development of nodes to interface on-board network and off-board systems.
Minor
Development of on-board data logger.
Optional
Literature review into current video solutions.
Major
Integration of video into off-board software system, to view alongside the acquired data.
Major
Implementation of wireless transmission of video stream(s).
Optional
Package the solution as a marketable product for potential customers.
Optional

Technical Risks

Below is a table that lists all the technical risks associated with the project proposal. Risk in this context is taken to mean any event or action (or inaction) that would jeopardise any project outcomes or significantly impede project progress. Along with the risk, actions have been provided that would be taken to mitigate the effects of the risk.


Possible Risk:
Mitigating Action:
1
Component of project not delivered by group member.
Regular meetings to check progress.
Management of deadlines.
2
Extended learning curve with on-board network.
Simplify the network.
3
Loss/damage of borrowed equipment from USM (car, ECU, sensors etc.).
Simulate data outputs.
4
Car unavailable to test system components.
Simulate testing environment e.g. using a road car.
5
Wireless communication not feasible.
Use on-car storage to transfer data to off-board systems
6
Wireless range not high enough to cover track.
Multiple base stations/burst transmission every lap.
7
Customer requirements change during the course of the project.
Formal specification agreed upon at start of project. All changes discussed with customer and approved before implementation.
8
Loss of software code.
SVN repositories used and adhered to throughout project.
9
Loss of documentation (reports etc.).
Make sure everything is saved to cloud storage.
10
Damage/loss to equipment (soldering etc.).
Where possible, multiple components to be bought within same order. Alternative equipment to be identified.
11
Budget constraints.
Research alternative components or discuss other sources of funding (i.e. USM).
12
Lead times.
Project management to take into account deadlines for orders, alternative suppliers to be used if required.
13
PCB complexity too high to be manufactured in house.
Outsource manufacture, taking into account extended lead times.
14
Lab space becomes inaccessible due to fire/flood etc.
Re-evaluate project objectives in discussions with mentor and customer. Video/photos/logbooks to be taken throughout to show progress.
15
Off-board software implementation too complex to develop within timescales.
Simplify software objectives.
16
Complexity of project under or over estimated.
Revise objectives.

Case Study: Dyno-Scan

The following blog post is a case study into the product Dyno-Scan for Windows which turns a Windows PC or laptop into a powerful automotive scan tool and road dynamometer.

Description

Dyno-Scan allows a user to check the engine light, data log engine sensors, measure horsepower and torque and much more using a Windows PC. Dyno-Scan supports 1996 or newer vehicles and it is very easy to use.

It has Bluetooth so the user can wirelessly connect or USB adapter hardware which plugs into the on-board diagnostics (OBD) II connector located under the dashboard in the car. The software works on all Windows operating systems and there is an optional Android software for tablets or phones. A user can read/clear the dashboard Check Engine light, view live data streams and for the more advanced user, there is a PID builder which allows the user to create custom enhanced live data parameters for any vehicle. There is support for over 264 vehicle parameters.

The user has access to thousands of generic and enhanced diagnostic trouble code definitions and a high speed CAN 6x communication mode reads six sensors per vehicle message making data throughput up to 6 times faster. The professional software automatically detects the vehicle protocol and supported parameters, making it very easy to for non-technical people to use. The user interface is customisable and it is easy to select parameters to view using line graphs and meters.

There is support for bi-directional control and the user can view multiple sensors simultaneously with variable sample rates. The user can record and playback live sensor data streams and there is support to print and export the data to an image file.

Vehicle Connection

Screenshots of the Software

Live Data Windows
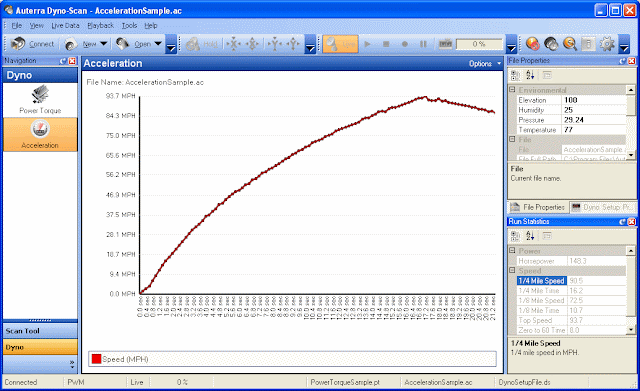
Acceleration Window
Analysis Window

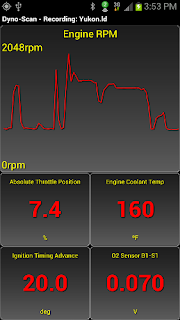
Android Software

Menu
Meter Readings
Live Data 
Parameter Selection

Specs

Size: 3.5" W x 1.75" H x 0.875" D
Weight: 4 oz
External Power: None - draws power from vehicle OBD II connector
Temperature: 32° to 158° F (0° to 70° C)
OBD II Protocols: J1850 (VPW, PWM), ISO 9141, ISO 14320 (KWP), and ISO 15765 (CAN bus)
PC Connection: Bluetooh Wireless or USB

Cost

Dyno-Scan for Windows Bluetooth is priced at $164.99 and includes the software, an OBD II adapter, an OBD II cable and quick start. Dyno-Scan for Windows CAN USB is priced at $149.99 and contains the same as before but with a USB cable as well.

Dyno-Scan for Windows Software is $49.99.
Dyno-Scan for Windows

Advantages of the Device


  • Connect wirelessly to the car or a simple USB connection
  • Supports a wide range of vehicles
  • Can create custom parameters
  • Database of diagnostic trouble code definitions
  • Free software upgrades
  • Support for over 264 parameters
  • Customisable user interface
  • Demonstration software

Disadvantages of the Device


  • Only suitable for Windows or Android

References

Project Description

Formula Student is an international design competition challenging students at university to design, build and manufacture a single seat race-car. The University of Strathclyde Motorsport (USM) team competes against other universities from across the world every summer at Silverstone and Hockenheim. It is important that design decisions throughout the process are justified and data driven. Therefore there is a need for data acquisition while running the car to allow simulated values to be compared with real-life values to validate designs.  The high performance nature of a racing car often means that components are operating at the limits of their design, requiring values to be monitored in real time while the car is running to keep them within safe limits.

The current team uses a DTA S80 Pro Engine Control Unit (ECU) to sense and control engine parameters such as oil and water temperature, a Race Technology DL1 Data Acquisition Unit (DAQ) to log analysis parameters such as suspension travel, steering angle and brake temperatures, and a smartphone to display some of these parameters.  The ECU outputs various data parameters onto a Controller Area Network (CAN) bus, which the smartphone is connected to via a Bluetooth device.  A CAN adapter has been purchased for the DAQ but it has not been possible to make it function correctly.  This has meant that all data on the CAN bus is not available to the DAQ to log.  Some CAN data logging functionality is available on the smartphone however this is limited and not easy to access.  Data is logged internally on the ECU, but again requires specialist software to access.

Concerns have been raised within the team that there are three different places that data is logged on the car, all with differing software packages to access and analyse the information.  This makes it difficult to compare values that have been recorded in different places, for example GPS information and oil temperature (DAQ/smartphone and ECU).  Team members are also unable to invest the time required to learn the different software packages.

Traditionally critical values (such as oil/water temperature etc.) have been displayed on the dashboard alongside RPM lights and current gear to allow the driver to monitor and act on while the car is running.  However most Formula Student tracks are very tight and test the driver’s skill and concentration.  Consequently the driver does not have time to accurately assess these values and drive to the best of their ability.  If the critical values could be monitored off the car in real time by other members of the team at the pits/side of the track, the driver could be warned and take action, without them having to constantly be checking the warning lights.

We propose to integrate all the data logging functionality on the car into one system, where all data is available everywhere. For example it would be possible to display accelerometer data on the dash or log RPM and gear position against GPS data, something that is not possible with the current system.  This would be done by developing an onboard embedded network that all devices on the car communicate through.  Sensor ‘nodes’ will be developed to directly convert analogue voltages to the network protocol, therefore also reducing the amount of wiring on the car as currently individual cables are run for every single sensor on the car.  This would also make the data acquisition set up a lot more flexible, allowing sensors to be added and removed as required.

In addition, it is proposed to develop a communication link between the on-board network and an off-board software system, allowing the sensed data to be monitored in real time by the pit crew.  The off-board system would allow team members to analyse the gathered data in a manner that is easy to use by an untrained engineer.

Finally, video systems are to be integrated into the project, enabling team members to see external factors that cause fluctuations in recorded telemetry. An example of this would be a driver taking a slightly different racing line in a corner.  This could also be used to assist in driver training and gain significant improvements in overall lap times.

The system is to be modular in design, allowing for it to be integrated into any other racing car in amateur racing series. The end product should also be lower in cost than other racing data acquisition/telemetry/video analysis systems, making it more affordable and accessible to amateur racers/Formula Student teams.

Friday, 25 October 2013

Case Study: VBOX Sport Performance Meter

The following blog post is a case study into the device VBOX Sport, a light-weight and portable data logger. Its purpose is to measure performance or lap times.

Description

VBOX Sport is a data logger than can be stand-alone or can be connected to an iOS device via Bluetooth. It has a robust and waterproof enclosure and it is lightweight so that it can be used with ease.

VBOX Sport connected to an iPhone via Bluetooth
The VBOX Sport contains a 20 Hz GPS engine with either an internal or external GPS antenna. It has a battery life of over 6 hours and this battery is rechargeable through USB charging. The VBOX Sport logs data onto an SD card. Included with the device is a Bluetooth interface to iOS devices, free data analysis software, free Performance Test and Laptimer app, and it is compatible with Harry's Lap Timer app.

Apps

Three dedicated iOS apps have been designed for the VBOX Sport. The first is a Performance Test app which displays speed, G-force and braking performance using GPS data that is being logged at 20 times per second. The second app is a LapTimer app which auto selects tracks, predicts lap times, determines the current or maximum speed, records lap times and allows for custom circuit creation. The final app is the Diagnostics app which checks the health of the VBOX Sport hardware and checks the GPS data reception.

In addition to these three dedicated apps, the VBOX Sport is compatible with the app Harry's LapTimer. This app records all types of sensor data provided by the iOS device and has fully automated GPS-based lap timing. This app is $19.99 where as the dedicated apps are free.
Harry's LapTimer App

Analysis Software

Circuit Tools Analysis Software is provided with the VBOX Sport. This software is designed by racing drivers and is easy to use. The SD card with the logged data is input to the PC and the file is selected within the software. The software then automatically detects the country, circuit and track configuration from a database of 400 circuits. To separate the laps contained in the file, start/finish line information is used. The software then determines the fastest lap from the session and displays this in the shape of a graph. Lap times can easily be compared to other laps using this graphing functionality.
Circuit Tools Analysis Software
Features of this software are as follows:

  • Automate tasks and present driver with crucial information quickly
  • Enhanced file loading - interface scans the file giving basic lap information and video preview
  • File transfer wizard - scans PC for removable media and transfers all files into automatically named folders on the hard drive
  • Automatic sector configuration - sector by max speed automatically configured and these can be toggled on and off in the session data
  • Video replay speed variation 
  • Six video playback - up to 6 videos can be played simultaneously

Performance Software

There is also a Performance Tools software that can be downloaded. Again, the software is easy to use by inserting the SD card and selecting the correct file. This software tool allows for analysis of the vehicle's performance, such as acceleration and braking tests.
Performance Tool Software

Specs

Below are a list of the different specifications of the device.

I/O

Inputs and Outputs of VBOX Sport

GPS SPECIFICATIONS

Velocity: 
  • Accuracy: 0.1 km/h
  • Units: km/h or mph
  • Update Rate: 20 Hz
  • Minimum Velocity: 0.1 km/h
  • Maximum Velocity: 1800 km/h
  • Resolution: 0.01 km/h
Acceleration:
  • Accuracy: 0.5%
  • Maximum: 4 G
  • Resolution: 0.01 G
Heading: 
  • Resolution: 0.01° s
  • Accuracy: ± 0.2° s
Position:
  • 2D Position: ± 5 m 95% CEP*
  • Height: 5 m 95% CEP*
*95% CEP (Circle of Error Probable) means 95% of the time the position readings will fall within a circle of the stated radius.

RECORDING AND STORAGE

Recording Options:
  • Record only when moving (default)
  • Record start/stop button
SD Card Memory Usage:
8.7 Megabytes/hour whilst logging.

Environmental and Physical:
  • Input Voltage: +5 volts only
  • Power: 2.5 W max. (charging)
  • IP Rating: IP65 (with connector bungs fitted), IP20 (without connector bungs fitted)
  • Size: 104.5 mm x 72.8 mm x 25.1 mm
  • Weight: 130 g
  • Storage Temperature: -20° C to + 60° C (max. limits), -20° C to +35° C for maximum battery life
  • Operating Temperature: -20° C to + 55° C, 0° C to + 45° C (whilst charging battery - charger will shut down outside this range)

SOFTWARE

Apple Software:
  • VBOX Sport Performance Test
  • VBOX Sport LapTimer
  • VBOX Sport Diagnostics App
Windows Software:
Circuit Tools data analysis software

Cost

The VBOX Sport costs $429.

Advantages of the Device


  • The data logger is very small and waterproof allowing the device to be placed in lots of locations.
  • Very simple to use - plug and play.
  • Software is easy to use and automates a lot of tasks.
  • The apps that are needed for the device are free. 

Disadvantages


  • The system is primarily designed for iOS devices.
  • No real time analysis - have to wait until race finished and SD card is put into PC.
  • Uses GPS - this could fail or have a poor reception.
  • Expensive for what it is.

References